Subscriber Content
Add content here that will only be visible to your subscribers.
Understanding Market Trends: Uptrend, Downtrend & Sideways

The financial market moves in patterns. These patterns are called market trends. Understanding trends is one of the most important skills for traders and investors. If you can correctly identify whether the market is moving up, down, or sideways, you can make better trading decisions.
Many beginner traders lose money because they trade against the trend. Experienced traders follow a simple rule:
“The trend is your friend until it ends.”
In this guide, we will understand the three main market trends and how to identify them.
What is a Market Trend?
A market trend is the overall direction in which the price of an asset moves over time.
Markets rarely move in a straight line. Prices move in waves with small ups and downs, but the overall direction forms a trend.
There are three types of market trends:
- Uptrend – Price is moving upward.
- Downtrend – Price is moving downward.
- Sideways Trend – Price moves within a range.
Identifying the trend helps traders decide whether to buy, sell, or wait.
1. Uptrend (Bullish Market)

An uptrend happens when the price consistently moves higher over time.
This means buyers are stronger than sellers.
Characteristics of an Uptrend
- Higher highs
- Higher lows
- Strong buying pressure
- Price stays above key moving averages
In simple words, the market keeps making new highs after small pullbacks.
How Traders Trade an Uptrend
- Buy during pullbacks
- Use support levels for entry
- Hold trades longer
- Avoid selling against the trend
Trend-following traders often look for opportunities to buy call options (CE) during an uptrend.
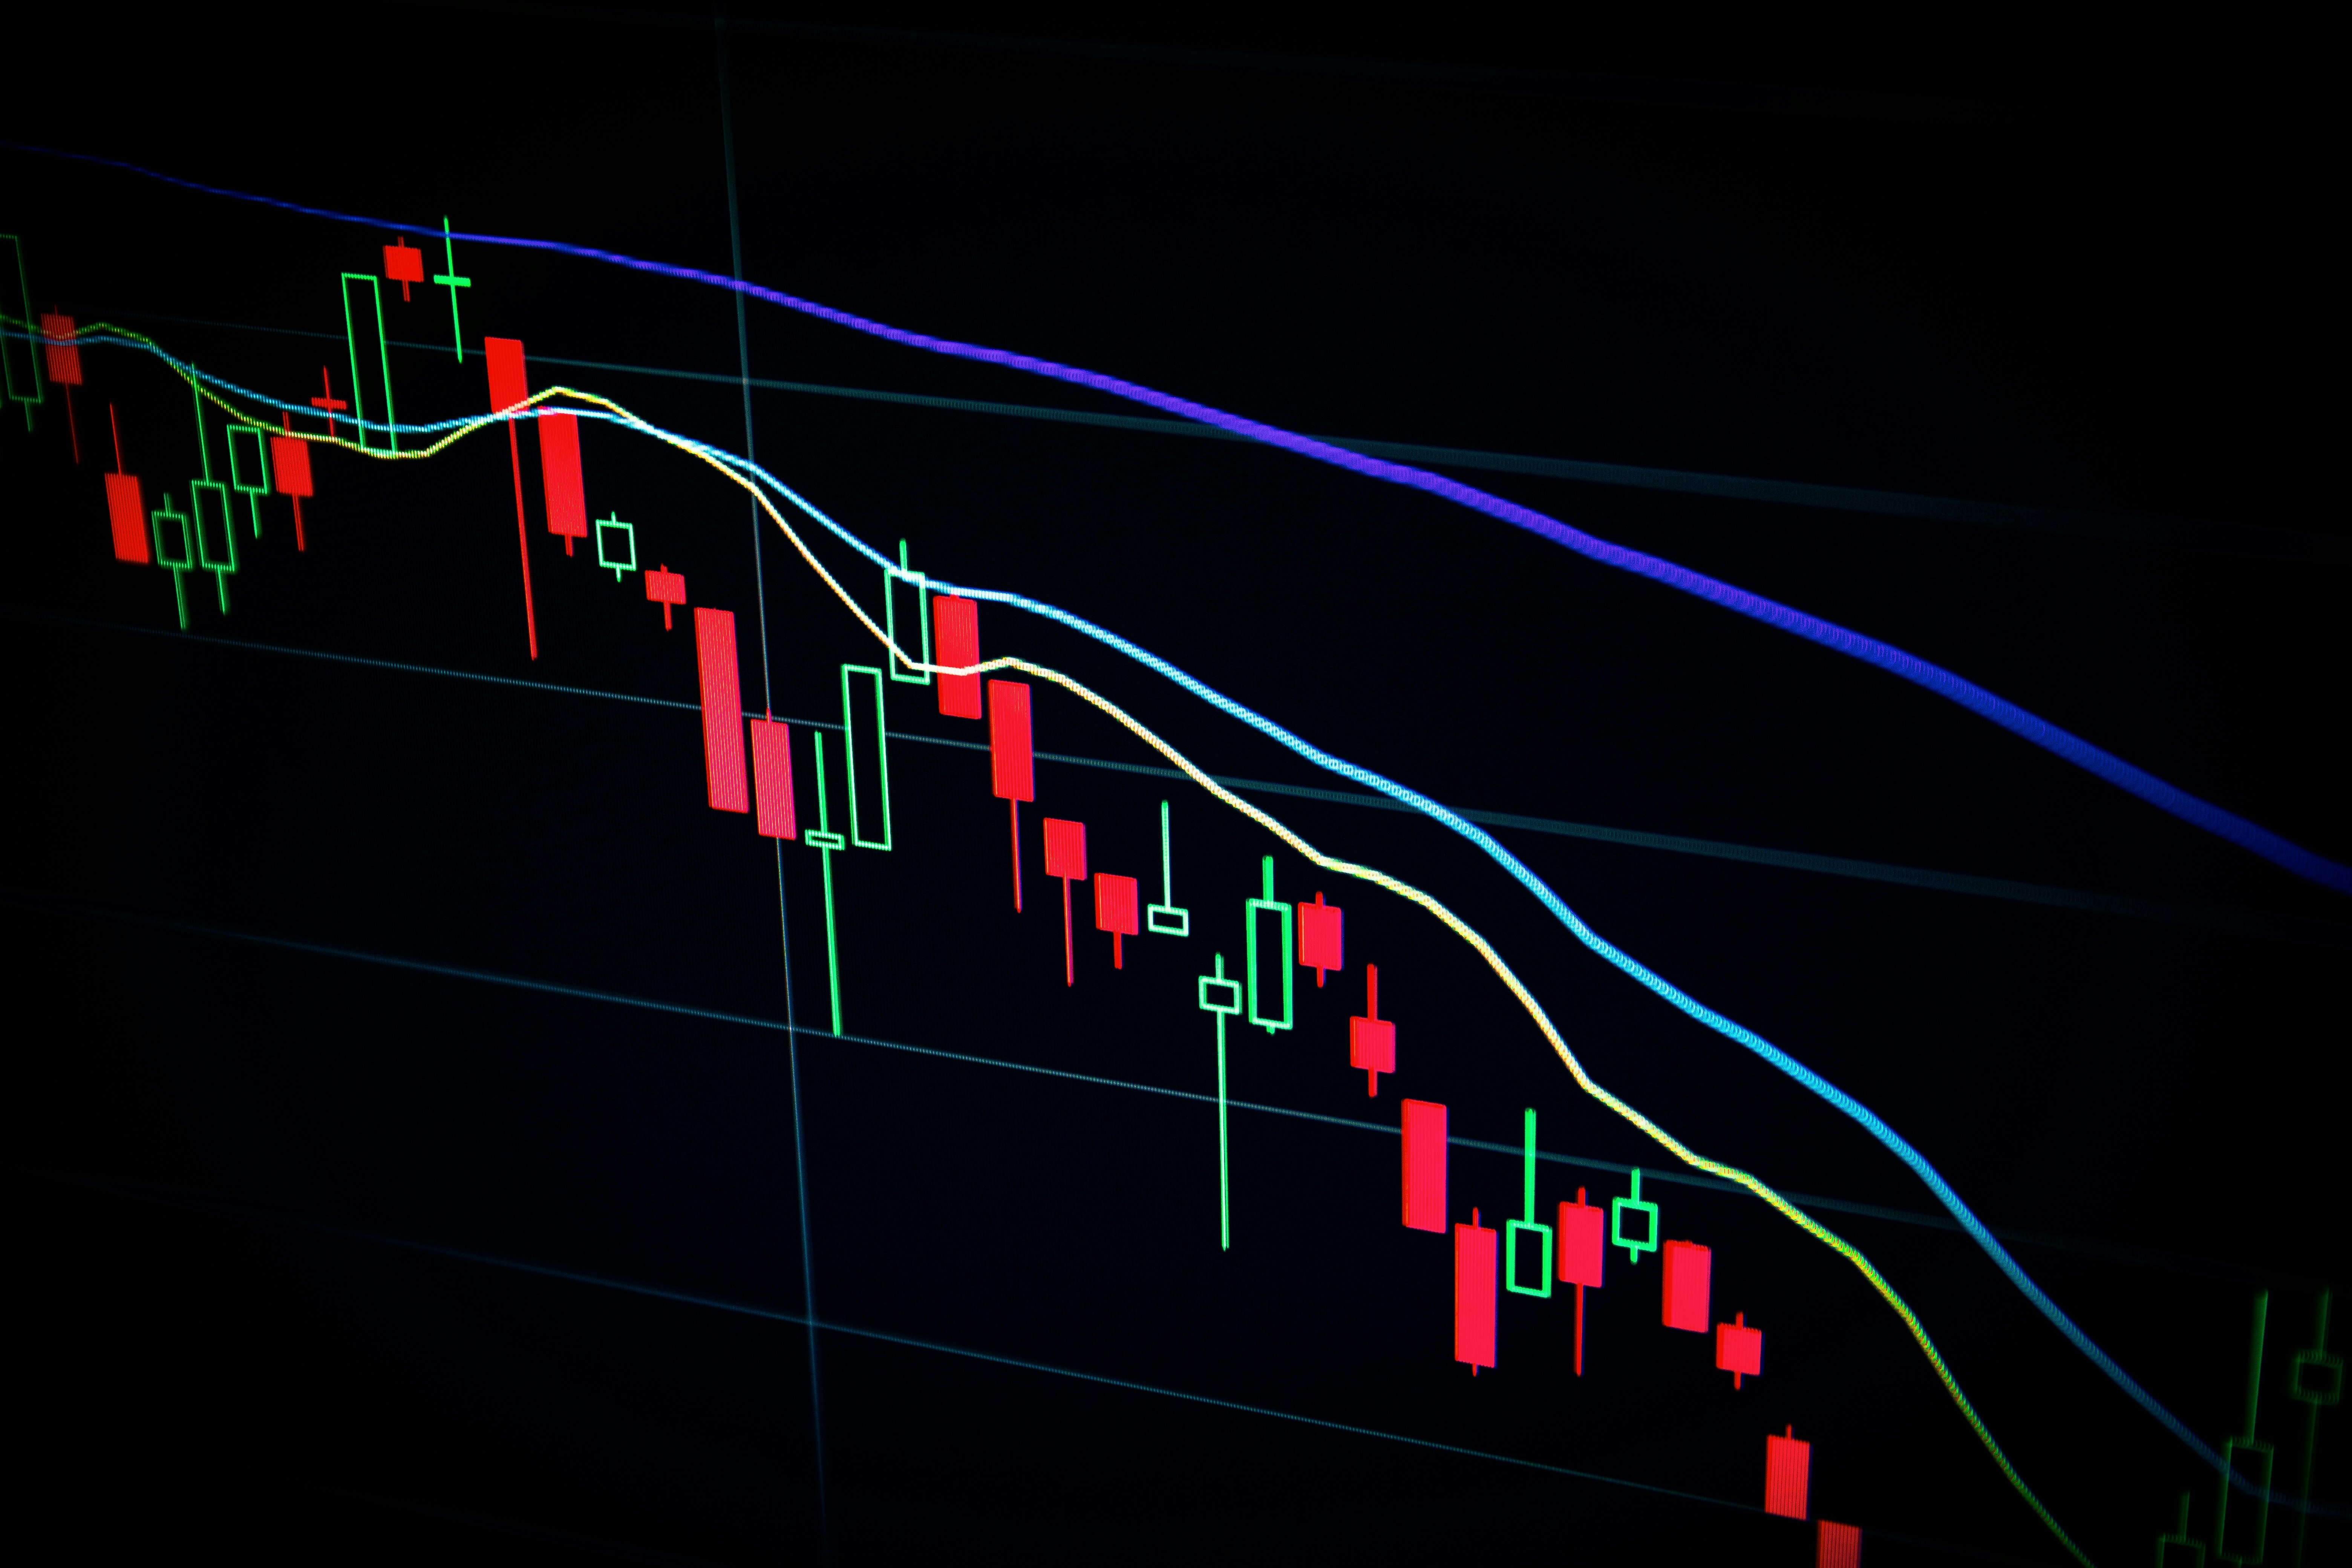
2. Downtrend (Bearish Market)

A downtrend occurs when the market price keeps moving lower.
This happens when sellers dominate buyers.
Characteristics of a Downtrend
- Lower highs
- Lower lows
- Strong selling pressure
- Price stays below resistance levels
Every bounce in a downtrend usually fails and the price continues falling.
How Traders Trade a Downtrend
- Sell during pullbacks
- Look for resistance levels
- Use stop-loss above recent highs
- Follow momentum indicators
Options traders often buy Put Options (PE) during strong downtrends.
3. Sideways Trend (Range Market)

A sideways trend occurs when the market moves within a horizontal range.
In this situation, neither buyers nor sellers control the market.
Characteristics of Sideways Market
- Price moves between support and resistance
- No clear direction
- Frequent fake breakouts
- Low momentum
How Traders Trade Sideways Markets
- Buy near support
- Sell near resistance
- Avoid breakout traps
- Use smaller targets
Many beginner traders lose money in sideways markets because the price keeps reversing.
Understanding Market Structure

Market structure refers to how price forms highs and lows.
It helps traders understand whether the market is bullish or bearish.
Three Key Elements of Market Structure
- Higher High
- Higher Low
- Lower High
- Lower Low
For example:
- Higher highs + higher lows = Uptrend
- Lower highs + lower lows = Downtrend
- Equal highs and lows = Sideways
Professional traders always check market structure before entering trades.
Trend Analysis Techniques

Trend analysis helps traders identify the direction of the market.
Popular Methods
- Trendlines
- Moving averages
- Support and resistance
- Price action analysis
- Indicators like RSI and MACD
Combining multiple methods increases the accuracy of trend detection.
How to Identify Market Trends

Identifying trends becomes easier with practice.
Step-by-Step Method
- Open a higher timeframe chart (15min, 1hr, daily).
- Check recent highs and lows.
- Draw support and resistance levels.
- Use moving averages to confirm trend direction.
- Wait for confirmation before entering trades.
This process reduces the chances of trading against the market.
Common Mistakes Traders Make
- Trading against the trend
- Ignoring market structure
- Entering trades without confirmation
- Overtrading in sideways markets
A disciplined trader waits for the correct market condition before taking trades.
Final Thoughts
Understanding market trends is the foundation of successful trading. By recognizing whether the market is in an uptrend, downtrend, or sideways phase, traders can make smarter decisions.
The key is patience and discipline. Instead of predicting the market, focus on following the trend and managing risk properly.
Mastering trend analysis will greatly improve your ability to trade consistently and confidently.
Estimated Reading Time: 14 minutes
Category: Trading Education